Maximization of the use of power transformers
Maximization of the use of power transformers
- 30/01/2015
- Distribution
Abstract
The purpose of this paper is to study the results of the implementation of the pilot project power transformer use maximization, without compromising the service life of the equipment and the reliability of the electric system while using the SMART monitoring system. This article describes the points that were considered in the implementation of the pilot project, the chosen substation, the definition of the “SMART” monitoring system, alternative detailing and result assessment as to the technical-economic and regulatory requirements, with attention to the tariff modicity. Finally, there was an analysis of the results obtained, among them the definition of the “SMART” monitoring system as the best alternative for maximization of the power transformer use and the development of other studies about how to apply the system.
| ELEKTRO | Adriano Cabrino |
| ELEKTRO | Akira Higa |
| ELEKTRO | Aluizio Vilela |
| ELEKTRO | Gilberto Martins |
| ELEKTRO | Lauro Ribeiro |
| ELEKTRO | Leandro Rodrigues |
| ELEKTRO | Luiz Alexandre |
| Treetech Sistemas Digitais Ltda. | Luís Lopes |

1.0 – INTRODUCTION
This paper is limited to the analysis of the performance of the pilot project of maximization of power transformer use, which was implemented in 2006, and which is scheduled to be concluded in April 2010, when the substation will be enlarged. This paper has also analyzed the way in which the aforementioned project has been carried out. For this purpose, points considered in the implementation of the pilot project were surveyed, such as the power transformer, electrical system planning, “SMART” monitoring system, and other complementary information. Next, the characteristics of the chosen substation were described. As to the definition of the “SMART” monitoring system, the points that determined its choice were listed. After that, with the purpose to analyze the pilot project, the existing alternatives were detailed.
The results of the pilot project were analyzed as to the technical-economic and regulatory requirements, this with an emphasis on the tariff modicity (it must be guaranteed as per the Distribution Concession Contract), which is not usually considered in the technical studies. Those same results have determined the use of the “SMART” monitoring system, because they indicated it as the best alternative for maximization of the use of power transformers. Moreover, they originated other studies on the application of the system, such as the revision of the scope of new substation digitization projects, the process of access request, the process of maintenance and the postponement of preservation investments.
2.0 – DEVELOPMENT
In the course of the first cycle of tariff reviews, ANEEL has issued the Resolution number 493, of Sept. 03, 2002, which established the methodology and general criteria for the definition of the regulatory remuneration base (BRR), aiming at remunerating prudent investments required for the utilities that can render the distribution service with an acceptable degree of quality. This means that the level of investment to be remunerated through the tariff coverage can neither encourage the excess of investments in the sector, nor project delay or interruption [1].
In the evaluation of the fixed assets in service, such as substation machines and equipment, for the purpose of inclusion in the regulatory remuneration Base (BRR), an index of utilization is applied (IAS) which considers the utilization factor of the substation and the expectation of load percentage growth for the substation for the next 10 (ten) years. That index is limited to 100% and is calculated of the following way [2]:
| FUS = DM / PTI | eq. 1 |
| ECC = (1 + TCA1) x (1 + TCA2) x ……. x (1 + TCA10) | eq. 2 |
| IAS(%) = FUS x ECC x 100 | eq. 3 |
where:
IAS → Substation utilization Index (%);
FUS → Substation utilization Factor (%);
DM → Maximum MVA demand verified in the last two years; PTI → total installed power in MVA (ONAF);
TCA→ annual growth percentage calculation of maximum load supplied by the substation;
ECC → Expectation of percentage growth of the load supplied by the substation for the 10-year projected period, proven by the records of demand increase of the last four years. For the purpose of consistency verification, load evolution in the last 4 years will be used, as well as the economic development premises of the area served by the respective substation.
In face of this regulatory scenario, the utility companies which distribute electric power have been challenged once again to seek harmony between technical and economic issues, especially connected to planning, operation and maintenance of the electric system.
In order to review the electric system’s planning, operation and maintenance criteria, a pilot project was developed that maximizes the use of the power transformer to meet this new assessment criterion of prudent investments.
The execution of the pilot project was structured as follows:
- Survey of the points considered in the implementation of the pilot project;
- Selection of substations;
- Definition of the “SMART” monitoring system;
- Alternative Detailing;
- Analysis of the results obtained.
2.1 – Survey of the points considered in the implementation of the pilot project
Power Transformer
- Accessory limit (current transformers and bushings) 50% above rated current;
- Microprocessor protection relays;
- Sealed oil preservation system (bag sealing);
- Forced ventilation and sealing system, cables, accessories and switch in good operating and maintenance conditions;
- Thermal aging of the insulation with a degree of polymerization above 500;
- Maintenance history without events that might affect reliability and/or cause premature wear and tear;
- Without limitation of the overload detected by gas-chromatography diagnosis.
Electric System Planning
- Electric System (Transmission and transformer line) sized to operate in overload without supply quality loss.
- Seasonal load system (risk mitigation);
- Criterion for the system expansion met (project begins when the substation load is higher than 90% and end when the load reaches 100% [3];
- Substation with Utilization Index (IAS) below 100% in the 2007 Tariff Review.
“SMART” Monitoring System
- In addition to the basic features (acquisition and storage) the system must be able to process data, so the diagnosis of the current status of the transformer can be done, and in some cases, based on the value progression collected along time, the prognosis of eventual problems which are still incipient.
- In calculating the loss of service life of the power transformer insulation, the water content in paper calculation must be taken into consideration for automatic correction of the thermal loss acceleration, when water content is high.
Complementary information
- In NBR-9368/86 [4] Standard, only 5 preferential rated power levels ONAN/ONAF for
- 34.5/13.8 kV and 69/13.8 kV; and 6 for 138/13.8 kV;
- Existence of systems with low vegetative growth rate;
- Any equipment operating above the conditions for which it was rated is always a risk situation;
- A power transformer is the most valuable and important asset of a substation.
2.2 – Selection of the substation
From the points considered for implementation of the pilot project, a substation was chosen of which the load is typically residential, with peak demand in winter (see figures 1 and 2). The substation has 2 138/13.8 kV,15/18,75 MVA transformers, which operate in parallel.
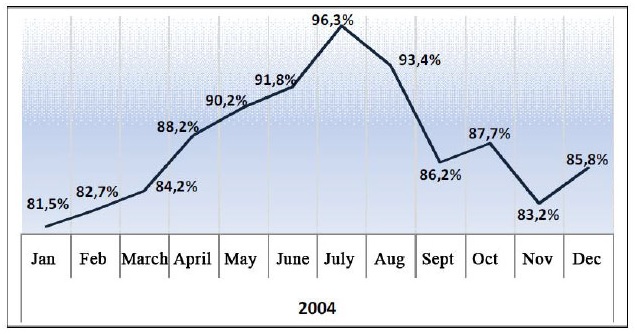
Figure 1 – Monthly Peak Demand
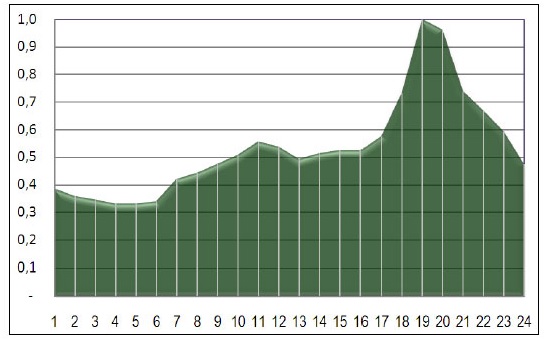
Figure 2 – Typical Load Curve [pu] of the substation
2.3 – “SMART” Monitoring System Definition
Among the monitoring systems in the market, the SIGMA (Maintenance Managing Integrated System), carried by Treetech, was our choice. The points that determined that choice are below:
- Moisture, Temperature and voltage regulation sensors present in the transformer are manufactured by Treetech and no further purchases or adaptations are necessary; and
- From the technical – economical point of view, these sensors were the best choice, since there was availability to rent the whole “SMART’ monitoring system and infrastructure, and this made software acquisition and expansion for the IT system unnecessary.
In the figure 3, see details of monitoring system architecture:
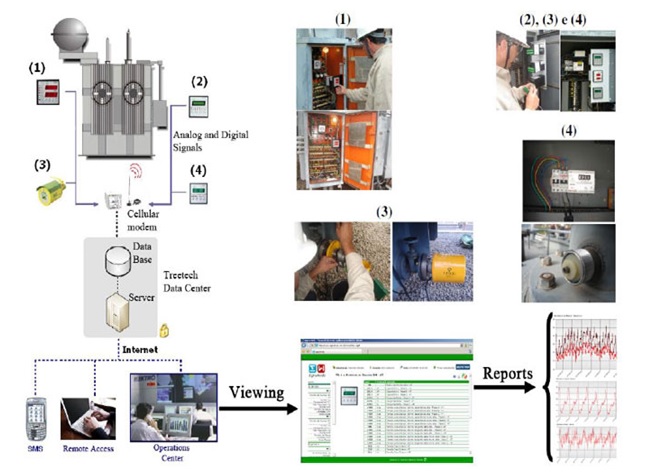
Figures 3 – System Architecture: (1) Temperature Monitor; (2) voltage regulating relay; (3) Gas (H2) and Water (H2the) in Oil Monitor; and (4) Bushing Monitor
2.4 – Alternative Detailing
To study the results of the pilot project, information was obtained with and without its implementation.
Information regarding the 2006-2010 Investment Plan Values realized in 2004 and predicted from 2005 to 2016
| 2004 | 2005 | 2006 | 2007 | 2008 | 2009 | 2010 | 2011 | 2012 | 2013 | 2014 | 2015 | 2016 | |
| Growth Rate (%) | – | 2,19 | 1,63 | 1,08 | 1,08 | 1,08 | 1,08 | 1,08 | 1,08 | 1,08 | 1,08 | 1,08 | 1,08 |
| Load (MVA) | 36,1 | 36,9 | 37,5 | 37,9 | 38,3 | 38,7 | 39,2 | 39,6 | 40,0 | 40,4 | 40,9 | 41,3 | 41,8 |
| Load (%) | 96,3 | 98,4 | 100 | 101 | 102 | 103 | 104 | 106 | 107 | 108 | 109 | 110 | 111 |
Information regarding 2010-2014 Investment Plan Values realized from 2004 to 2008 and predicted for 2009 to 2020
| 2004 | 2005 | 2006 | 2007 | 2008 | 2009 | 2010 | 2011 | 2012 | 2013 | 2014 | 2015 | 2016 | 2017 | 2018 | 2019 | 2020 | |
| Growth Rate (%) | – | 0,53 | 3,31 | 5,74 | 10,1 | -5,9 | 4,51 | 4,79 | 4,07 | 3,79 | 3,79 | 3,79 | 3,79 | 3,79 | 3,79 | 3,79 | 3,79 |
| Load (MVA) | 36,1 | 36,3 | 37,5 | 39,7 | 43,7 | 41,1 | 42,9 | 45,0 | 46,8 | 48,6 | 50,5 | 52,4 | 54,3 | 56,4 | 58,5 | 60,7 | 60,7 |
| Load (%) | 96,3 | 96,8 | 100 | 106 | 116 | 110 | 115 | 120 | 125 | 130 | 135 | 140 | 145 | 150 | 156 | 162 | 168 |
Alternative 01: With the Implementation of the Pilot Project
Project 1: “SMART” Monitoring Installation in the Power Transformers TR01 and TR02
Conclusion Year: 2006
Total cost: R$ 188 thousand
Project 2: Substation Expansion – 15/18.75 MVATR01 to be replaced with 25/33.3 MVA transformer Conclusion Year: 2010
Total cost: R$ 2,290 thousand
IAS for 2007 Tariff Review: 111.4% (see eq. 03 and table 1) IAS for Tariff Review 2011: 121.1% (see eq. 03 and table 2)
Expenditure Schedule for Alternative 01
| R$ thousand | ||||||
| 2005 | 2006 | 2007 | 2008 | 2009 | 2010 | TOTAL |
| – | 45 | – | 36 | 182 | 2.231 | 2.494 |
Alternative 02: Without the Implementation of the Pilot Project
Task 1: Substation Expansion – 15/18.75 MVATR01 to be replaced with 25/33.3MVA transformer
Conclusion Year: 2006
Total cost: R$ 2,290 thousand
IAS for Tariff Review (RT) 2007: 80.3% (see eq. 3 and table 1) IAS for Tariff Review (RT) 2011: 121.1% (see eq. 3 and table 2)
Income not obtained with the Fixed Assets in Service (AIS) at the substation in the 2007 Tariff Review (RT)
| (A) | (B) | (C) | (D) | (E) | (F) | (G) | (H) | (I) |
| Basic Remuneration of Francisco Morato Substation (R$ thousand) |
Project 1 | Total (A) + (B) | IAS (RT 2007) | Basic Remuneration Non Remunerated (R$ thousand) | 2007-08 | 2008-09 | 2009-10 | 2010-11 |
| 386,2 | 2.290 | 2.676 | 80,3% | 527 | 77 | 87 | 87 | 91 |
(A) Value validated by ANEEL in the 2007 Tariff Review; (E) Non-Remunerated Asset = (C) x (100 – (D))%
(F) Income not Earned = (E) x (Regulatory Remuneration Rate) = 9.95% to it.)1 x (Depreciation Rate = 4.63%)1
(G, H and I) Income not Earned = (E) x (Regulatory Remuneration Rate= 9.95% per year)1 x Depreciation Rate = 4.63%)1 x (1 + Variation of the IGP- M (General Market Prices Index) for 2007-08)
Expenditure Schedule for Alternative 02, with the loss of income from the Fixed Assets in Service (AIS) at the substation
| R$ thousand | ||||||
| 2005 | 2006 | 2007 | 2008 | 2009 | 2010 | TOTAL |
| 90 | 2.200 | – | 77 | 87 | 87 | 2.541 |
2.5 – Analysis of the results obtained
2.5.1 – Economic Analysis
In order to analyze this situation, the current value of the alternatives was calculated for 2005
(see eq. 4).
Vp = Vn / (1 + j)n eq. 4
where:
Vp = Current Value of the Investment
Vn = Current Value of the Investment j = Annual Interest Rate2
n = Number of Years
Therefore, the current value of the alternatives is:
Alternative 01 = R$ 1,581 thousand
Alternative 02 = R$ 2,262 thousand
The implementation of the Pilot Project (alternative 01) resulted in one economic profit of R$ 681 thousand regarding alternative 02. Moreover, regardless of the alternative, integral remuneration for the fixed asset being used in the substation is expected to take place in the 2011 Tariff Review.
2.5.2 – Technical Analysis
2.5.2.1 – Loss of Service Life of the Power Transformer Insulation
In the period from Dec 22, 2008 to Feb 08, 2010 (see figure 4), the loss of insulation service life was:
| (%) | (Year) | |||
| Calculated³ | Regulatory^4 | Calculated³ | Regulatory^4 | |
| TR01 | 0,050 | 2,836 | 0,020 | 1,134 |
| TR02 | 0,045 | 2,836 | 0,018 | 1,134 |
1 Values Defined in the 2007 Tariff Review (see Technical Note number 267/2009 [5]).
2 The value of 9.95% per year, which is the ELEKTRO Regulatory Remuneration Rate, defined in the 2007 Tariff Review by the ANEEL (see Technical Note nº 267/2009 [5]).
3 In The calculation of the loss of service life of the transformer insulation was deemed to be the calculation of water in paper content.
4 According to the Normative Resolution n° 367/2009, of June 02, 2009 [6], the Yearly Depreciation Rate of the power transformer is of 2.5% (Regulatory service life of 40 years and daily depreciation rate of 0.00685%).
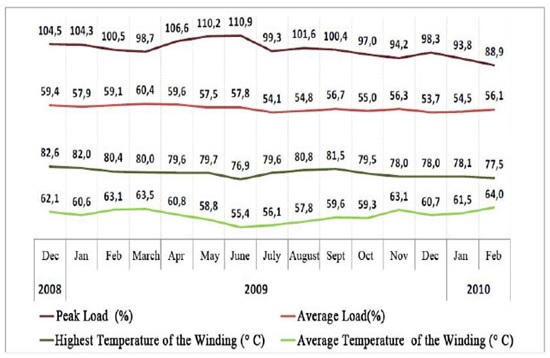
Figure 4 – Load and Temperature of the Power Transformer Winding TR01 – Peak and Average per month, from Dec. 22, 2008 to Aug. 02, 2010
In that same period, even operating above the rated capacity, the loss of service life of the insulation calculated in TR01 and TR02 power transformers was respectively 57 and 63 times lower than the regulatory loss. The difference between the calculated service life loss of the TR01 and TR02 is directly connected to the difference of the average temperature of the winding 5 (see Table 6).
Temperature and Average current in the Power TR01 and TR02Transformer Winding between Dec 22,2008 and Feb 02,2010
| Average temperature of the winding (ºC) | Average Current of the Winding^6 (A) |
|
| TR01 | 60,15 | 437 |
| TR02 | 59,15 | 433 |
Figure 5 shows the period in which TR01 had the biggest loss of calculated service life. Even in that period, the calculated loss was found to be below the regulatory loss.
In the comparison of a period with load above rated and other with the highest loss of service life (see figure 6), there is a big influence of the ambient temperature.
The remaining service life of the insulation for the TR01 and TR02 transformers, calculated as a function of the percentage of remaining life, 7 and of the average insulation service life loss rate by the monitoring system, is over 50 years.
5 According to the Arrhenius law, the higher the temperature of the winding, the smaller the insulation service life expectancy of the power transformer (see NBR-5416/97 [7]).
6 The difference of the average current of the winding between power transformers TR01 and TR02 has to do with the difference in impedance.
7 The percentage of remaining life of the power transformers TR01 and TR02, analyzed before the beginning of service life loss insulation monitoring through the degree of paper polymerization, is, respectively, of 60% and 45%. On the other hand, the percentage of remaining regulatory life is 25% (equipments manufactured in 1978).
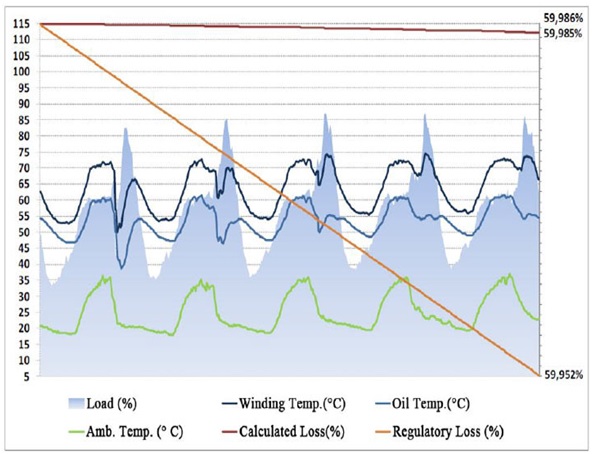
Figure 5 – TR01 Power Transformer Measurements carried out between Feb. 01 and Feb. 05 2010

Figure 6 – Measurements of the TR01 Power Transformer carried out between: (1) June/11 and June 15,2009 and (2) Feb. 01and Feb. 05, 2010 (plotted in the same scale)
Regarding the loss of insulation service life, it is possible to draw the conclusion that the transformers installed at the substation can operate in continuous overload, as long as the equipment meet the points considered in item 2.1 and their physicochemical conditions do not go beyond the limits that cause acceleration of the insulation aging process.
2.5.2.2 – Analysis of the Power Transformer Insulating Oil
Physicochemical
During monitoring process the three oil collections done for TR01 and TR02 physicochemical analysis, yielded the following results:
| Limits of the NBR 10576/2006 |
Unit | TR01 | TR02 | |||||
| 3/13/2007 | 7/15/2008 | 3/13/2009 | 3/13/2007 | 7/15/2008 | 3/13/2009 | |||
| Interfacial Voltage at 25ºC | 22 minimum | mN/m | 33.8 | 33.5 | 33.2 | 30 | 26.9 | 27 |
| Water Content (Corrected at 20ºC) | 15 maximum | ppm | 8 | 4 | 5 | 10 | 11 | 9 |
| Neutralization Index | 0.15 maximum | mg KOH/g | 0.018 | 0.022 | 0.021 | 0.047 | 0.066 | 0.053 |
| Dielectric rigidity (Hubcap) | 50 minimum | kV/2,5mm | 72.0 | 75.0 | 75.0 | 76.8 | 76 | 73 |
It has been determined that the physicochemical values did not undergo any changes.
Gas Chromatography
Regarding the gas-chromatography diagnosis, values remained constant.
Final analysis
It can be stated that the insulating oil was not affected by the overload period. That result is due to the asset management based on predictive maintenance that was carried out at the correct periods, thus retarding the oxidation, pyrolysis and hydrolysis processes.
2.5.2.3 – Operational Reliability
The “SMART” Monitoring System has offered a high reliability for the Distribution Operations Center (COD) to be able to make real time decisions. The reason for that was the certainty that, if some fail had arisen, the SMART Monitoring System would anticipate it, and this fact was compromising the service life expectation for the insulation. Moreover, all interventions carried out in the sensors of the monitoring system were done while the power transformer was in operation, thus increasing the reliability of the electric system.
According to the results already presented, no alarms went off and/or no notice was issued by the monitoring system. In Table7, there is a comparison between tools available in the monitoring systems in existence and the “SMART” system.
2.5.3 – Regulatory Analysis
In order to carry out a regulatory analysis, in the simulation of FACTOR X [2] the hypothetical use of alternative 02 has been considered. For this purpose, the amount of R$ 1763 thousand was added to the 2007 basic regulatory remuneration8 and the amount of R$ 1.899 thousand9 was deducted from the investment plan submitted to ANEEL. See below the result of the simulation:
Average tariff (2007-08 to 2010-11) – Addition of 0.102% in comparison to the value calculated in the Review 2007 Tariff 10.
8 The amount of R$ 527 thousand was deducted, referring to the Index of Utilization of the Substation (IAS) of 80.3% (see table 4).
9 Amount corrected by the IGP-M, since the simulation spreadsheet of FACTOR X uses the Aug/2007 basis.
10 The predicted investments in alternative 01 were taken into consideration in the calculation.
Comparison between the tools of the existing power transformers monitoring systems and “SMART” (pilot project)
| Items monitored in the power transformer | Other existing monitoring system | “SMART” monitoring system |
| Monitoring of the winding and oil temperature | x | x |
| Voltage monitoring | x | x |
| Load monitoring | x | x |
| Gas monitoring (H2) | x | |
| Water monitoring (H2O) | x | |
| Bushing monitoring | x | |
| Insulation thermal aging monitoring | x | |
| Forecast of temperatures of the oil and of the windings | x | |
| Forecast and calculation of the winding maximum temperature allowed without bubble formation risk | x | |
| Calculation of the minimum oil temperature allowed for formation of free water | x | |
| Natural and forced cooling system efficiency monitoring | x | |
| Simulation of the current load and ambient conditions | x | |
| Simulation of hypothetical load and ambient conditions | x | |
| Diagnosis, recomendation of corrective/preventive actions and complication prognosis if the defect is not corrected | x |
In addition to being considered a prudent investment, according to the results, verified by IAS and the technical analysis, the pilot project has also provided tariff modicity which shall be guaranteed by the distribution utility, according to the first subparagraph of the third clause of the Contract of Electric Power Distribution Concession ANEEL-ELEKTRO nº 187/98 [8].
3.0 – CONCLUSIONS
The results obtained with the implementation of the pilot project were:
- Economic earnings of R$ 681 thousand;
- The calculated insulation service life loss in TR01 and TR02 power transformers was, respectively, 57 and 63 times under the regulatory loss;
- There was no degradation of the insulating paper of the power transformers;
- Increase in the operational reliability, even with the power transformers operating in overload;
- Guaranteed tariff modicity.
The results of the pilot project, in addition to having defined the use of the SMART monitoring system as the better alternative for the maximization of the power transformer use, originated other studies for the application of the system, like, for example:
- the review of the scope of the new projects of substation digitization (possible benefits, for instance, alteration of the criterion of the automatic recovery of the substation, of which the remaining power transformer has a limited capacity currently 100% of its rated load).
- The process of access request with anticipation of the service until the conclusion of the substation expansion project;
- Maintenance process aiming at altering the preventive method, based on time, to predictive, based on the status of the equipment, so it is possible to implement maintenance focused on reliability (MCC) in the future (possible profits, for instance, reduction of the transformer insurance, elimination of oil collection, and reduction of maintenance frequency;
- Postponement of the investment in preservation (renovation), for those cases in which the power transformer has a high failure risk;
The conclusion was that the pilot project, in addition to obtaining fully positive results at the technical-economic level, normally analyzed in technical projects, has also obtained significant regulatory results.