Comparative Tests Report between the Treetech Online Moisture Monitor and the Water Content Analysis by Karl Fischer
Technical Report – Comparative Tests between the Treetech MO Online Moisture Monitor and the Water Content Analysis by Karl Fischer
- 19/01/2015
- Distribution
Abstract
This report presents the data obtained from deployment of two MO Moisture Monitors in an oil drying machine at Elektro’s Tatuí Substation. It also brings the comparison between the online readings of this equipment and the water content analyses performed using the Karl Fischer method. In order to do this, the lab equipment was taken to the above mentioned substation on 05/04/2007, thus allowing direct comparison between the online readings and those obtained in laboratory with reduced contamination risk for oil samples.

| Treetech Sistemas Digitais Ltda. | Marcos E. G. Alves |
1.0 – SETUP CONFIGURATION
Figure 1 shows the set up configuration used, where it is possible to see the in line Zeon oil drying machine coupled to a 10/12.5 MVA 138/13.8 kV power transformer filled with insulating mineral oil.
The oil leaves the transformer through the lower drainage tap, which is connected to the entrance of the machine by way of double-wall flexible hosing. After going into the machine, the oil crosses a Treetech MO Moisture Monitor sensor, then directly to an oil circulation pump and the absorption elements, where the water is retained and the oil is allowed to flow through. The flow proceeds to the exit of the machine, where it crosses a second MO moisture monitor sensor and returns to the transformer by way of a valve located in the inferior part of the conservation tank.
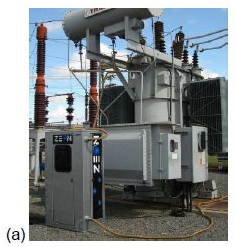


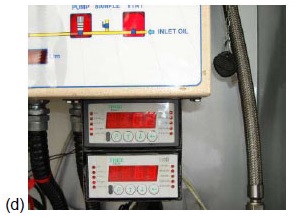
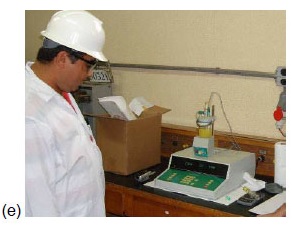
Figure 1 – Set up configuration; a) Zeon drying machine; b) MO Sensor at entrance to machine; c) MO Sensor at exit; d) interface modules; e) Metrohm Water Content Measurement Device.
In their turn, Moisture Monitors MO 1 and 2 are connected to a GPRS modem through their RS 485 serial communication ports, thus allowing remote online reading of the water in oil content for the oil going in and out of the drying machine. Remote access also allows downloading of data saved in the mass memory of the moisture monitors, allowing tracking of the progress of the oil drying process and condition monitoring of the absorption elements, which must be replaced when they become saturated with water.
2.0 – TESTS PERFORMED
The configuration described above, with a moisture sensor receiving the moisture-loaded oil at the entrance of the drying machine, and another at the exit, receiving the oil that has been dried, allows comparison of the online readings with laboratory results in at least two different water content situations.
To this end, a Metrohm water content measuring device was installed in one of the substation workshops, from laboratory MGM Diagnostics Ltda. In this way, the different samples taken from the oil flow at the entrance and exit of the drying machine were immediately analyzed on the Metrohm device, allowing their water content to be determined with low risk of contaminating samples due to prolonged weather exposure times occurring in transportation.
The sequence of tests is shown in tables 1 and 2 for moisture monitors 1 and 2, respectively. At the end of these tests, two additional oil samples were taken, both at the outlet of the oil drying machine, where the lowest water contents are found. One of these samples was tested in the laboratory three hours later on the same day. The other sample was tested 4 days later, on 09/04. The water contents obtained were 2.5 ppm for the sample tested on the same day and 2.8 ppm, 4 days later.
MO Moisture Monitor 1
| Time | Lab (ppm) | MO (ppm) | Oil Temp (°C) | MO (RS%) | Sample Number | Observations |
| 10:15 | 2,1 | 0,4 | 26,4 | 0,5 | 1 | Sample taken at machine outlet, inside casing |
| 10:19 | 2,3 | 0,4 | 26,4 | 0,5 | 1 | |
| 10:37 | Sensor displaced 10 mm, away from oil flow | |||||
| 10:52 | 0,6 | 31,4 | 0,7 | |||
| 10:52 | Sensor displaced 20 mm, away from oil flow | |||||
| 11:02 | 0,5 | 31,6 | 0,3 | |||
| 11:03 | Sensor returned to original position | |||||
| 11:05 | 1,9 | 0,3 | 32,4 | 0,3 | 3 | Sample taken at machine outlet, in the oil reservoir (conservator tank). |
| 11:07 | 1,9 | 0,3 | 32,4 | 0,3 | 3 | |
| 11:27 | Oil pump switched off | |||||
| 11:27 | 0,2 | 32 | 0,2 | |||
| 11:34 | 0,3 | 31,8 | 0,3 | |||
| 11:46 | 0,6 | 31 | 0,7 | |||
| 11:47 | Oil pump switched on again | |||||
| 11:47 | 0,6 | 31,2 | 0,7 | |||
| 11:50 | 0,3 | 32 | 0,3 | |||
| 13:40 | 0,3 | 39,1 | 0,3 | |||
| 13:53 | Sensor moved to entrance of drying machine | |||||
| 13:55 | 8 | 38,7 | 7 | |||
| 13:57 | 8 | 38,6 | 6,8 | |||
| 14:00 | 7,8 | 38,4 | 7 | |||
MO Moisture Monitor 2
| Time | Lab (ppm) | MO (ppm) | Oil Temp (ºC) | MO (RS%) | Sample number | Observations |
| 10:30 | 8,8 | 6,4 | 33,7 | 6,7 | 2 | Sample taken at machine intake, at exit from transformer |
| 10:32 | 8,8 | 6,4 | 33,7 | 6,7 | 2 | |
| 11:20 | 7,3 | 6,5 | 4 | Sample taken at machine intake, at exit from transformer | ||
| 11:22 | 8,3 | 6,5 | 4 | |||
| 11:25 | 8,7 | 6,5 | 4 | |||
| 11:27 | Oil pump switched off | |||||
| 11:27 | 6,5 | |||||
| 11:34 | 7,5 | 32,4 | ||||
| 11:46 | 7,6 | 31 | ||||
| 11:47 | Oil pump switched back on | |||||
| 11:47 | 7 | 33,3 | ||||
| 11:50 | 6,9 | |||||
| 13:40 | 7 | 38,7 | 6,1 | |||
| 13:53 | Sensor moved to entrance of drying machine | |||||
| 13:55 | 2,7 | 38,1 | 1,9 | |||
| 13:57 | 1 | 37,9 | 0,8 | |||
| 14:00 | 0,4 | 37,5 | 0,3 | |||
3.0 – RESULTS ANALYSIS
3.1 – Repeatability and Stability of Readings
The chart in figure 2 offers a visual comparative between readings taken online during the tests and the results obtained using the Karl Fischer method. The chart shows a good level of correlation between the methods.
The repeatability of the readings is evidenced by inverting the sensors, with the sensor initially placed at the entrance (wetter oil) being placed at the outlet (drier oil) and vice-versa.
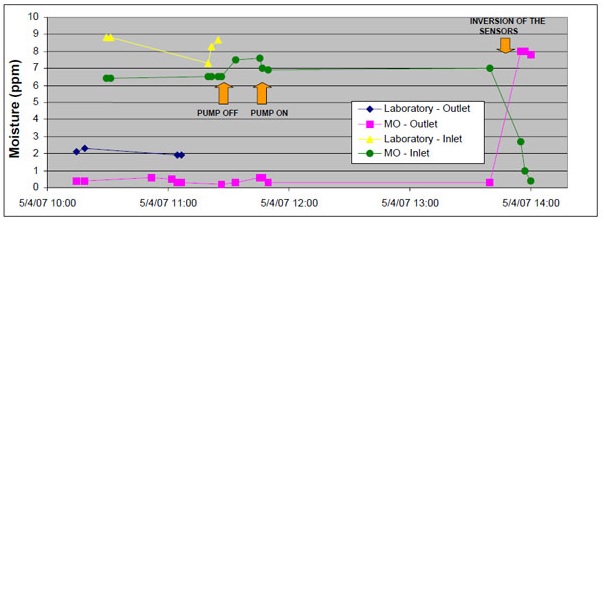
Figure 2 – Online and laboratory readings for water in oil content
Figure 2 allows us to conclude that the online readings displayed a high level of stability, since they were not influenced by factors related to the removal, handling and processing of samples, such as happens in laboratory readings. This fact can be evidenced by the fact that the online readings at the entrance to the machine remained stable at around 6.5 ppm from 10:30 to 11:30 am, laboratory readings showed variations of up to 1.5 ppm, beginning at 8.8 ppm, dropping to 7.3 ppm and returning to 8,7 ppm.
3.2 – Response time of the Online Moisture monitor
The inversions of sensors performed during the tests allowed quantification of the response time of the online sensors to a change in the level of water content. Taking the readings of the sensors that was moved from the entrance (higher water content) to the outlet of the machine (lower water content), it can be seen that the reading went from the starting value of 7 ppm at 1:53 pm to the final value of 0.4 ppm at 2 pm.
In this way, the sensor reacted completely to the degree of change in water content in approximately 7 minutes, therefore, inferior to the rated response time of 15 minutes.
3.3 – Influence in lab readings of time passed after samples are taken
Water content readings in samples transported for analysis in laboratory later do not display significant variations in relation to readings taken with the same equipment at the substation site, both for the same day and for the 4 days later analysis.
This result confirms that, once the sampling process is correctly performed with appropriate equipment, samples can be transported and stored for a few days without impacting on the results.
3.4 – Influence of oil flow rate on online readings
The influence of oil flow rate on online readings was checked by switching the oil pump on and off. The result is shown on the chart in figure 2, where a rise of 1 ppm can be seen in the online reading at the entrance of the machine when the pump is switched off, and a drop of 0.5 ppm when the flow rate is reestablished. The small magnitude of the changes indicates that the effect of oil flow rate on the readings can be disregarded, even though it could be completely eliminated by placing a baffle plate in front of the sensor set.
At the exit of the machine, with lower water content, the influence of the flow rate on the readings obtained was even smaller, on the order of 0.3 ppm.
3.5 – Comparison between Online and Laboratory Readings
Comparison between online and laboratory readings, considering the error limits for each process – +/- 1.7 ppm at 30°C for online readings and +/- 2 ppm for laboratory readings – is shown on the charts in figure 3 for the entrance and the exit of the machine. Dotted lines above and below each reading indicate the respective upper and lower tolerance values, obtained by adding or subtracting the rated error tolerance limit.
These charts visually show the existence of a large intersection area between the online and laboratory readings. Both at the exit and the entrance to the drying machine, the upper tolerance limit of the readings reaches the laboratory reading, and the laboratory’s lower tolerance limit reaches the actual online reading obtained. Therefore, this proves that the differences found between the online and laboratory reading methods remain within the error limit tolerances of both methods.
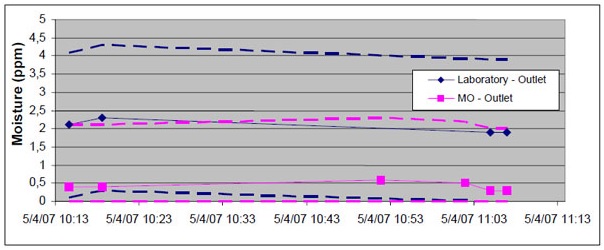
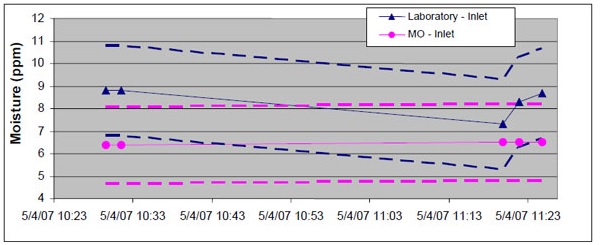
Figure 3 – Upper and lower tolerances of online and laboratory water content readings
3.6 – Correlation between Online and Laboratory Readings
Correlation between both reading methods can be more easily visualized based on the chart in figure 4, which shows the online readings (on the vertical axis) as a function of laboratory readings (horizontal axis).

Figure 4 – Online water content readings as a function of laboratory readings
The minimum squares method was used to determine the equation that best correlates the reading data obtained from both methods, considering a simple 1st degree equation:
(H20 Online) = 0.9462 * (H2) Lab) – 1.5226
Starting from this equation, shown in the dotted line in figure 4, presuming that the laboratory readings correspond to the actual water content in the oil, the following can be concluded:
1) Online readings respond to variations of water content in oil in a practically ideal form, as shown by the proportionality factor very close to one (0.9462);
2) The online readings represent an offset of approximately 1.5 ppm in relation to the water content of the sample, as shown by the equation’s independent constant (-1.5226).
Based on these two constants, we realize that the difference between the online and laboratory readings previously observed, even though falling within the tolerance ranges of both methods, is caused mainly by an offset error on the order of 1.5 ppm.
Even though the difference between the online and laboratory readings fall within the error tolerance used in both methods, and responses to variations in the water in oil content are not affected by this offset, it can be compensated, if desired, by small adjustments made to the offset of the online moisture monitor.
In order to test this type of adjustment, it was performed after the end of the tests, altering the machine’s input sensor off-set parameter from 0.785 to 0.738 and the exit sensor’s from 0.797 50 0.750. With this, online readings change to 9.6 ppm and 1.5 ppm, respectively, closer to the values obtained by the laboratory equipment.
4.0 – CONCLUSIONS
The results of the tests described lead to the following conclusions:
- The online moisture monitor MO is capable of effectively indicating changes in oil moisture content, once it reacts almost ideally to variations of oil in water content, i.e., with a proportionality factor very close to 1 (one).
- The good level of response to variations in oil moisture content was also attested by changing sensors from the entrance of the machine to the outlet and vice-versa, thus causing known changes in the thresholds of oil moisture content.
- The sensor position change test also proved the repeatability of the online readings, since these did not change significantly after the sensors were exchanged.
- The sensor position change test also determined the response time to variations in the water content, found to be on the order of 7 minutes.
- Comparison between online and laboratory readings showed that differences observed do not exceed the error limits for both methods.
- By correlating the online and laboratory readings it was perceived that the difference between them is caused mainly by an offset error, on the order of 1.5 ppm.
- Even though the difference between the online and laboratory readings fall within the error tolerance used in both methods, and responses to variations in the water in oil content are not affected by this offset, it can be compensated, if desired, by small adjustments made to the offset of the online moisture monitor.